

Statistical Process Control (SPC) Matters in Manufacturing
In today’s competitive manufacturing industry
maintaining consistent product quality is essential for business success. Even a small defect in a production process can lead to rejected products, material waste, costly rework, delayed deliveries and dissatisfied customers. Over time, these issues increase production costs and reduce profitability. This is where Statistical Process Control becomes valuable, helping manufacturers monitor production performance, maintain quality standards and improve operational efficiency.
Traditional quality inspection focuses mainly on identifying defects after products have been manufactured. However, detecting a defect at the end of production does not always reveal its root cause or prevent it from happening again. Statistical Process Control in manufacturing takes a proactive approach by analysing production data, identifying unusual changes and helping teams address potential problems before they affect product quality on a larger scale.
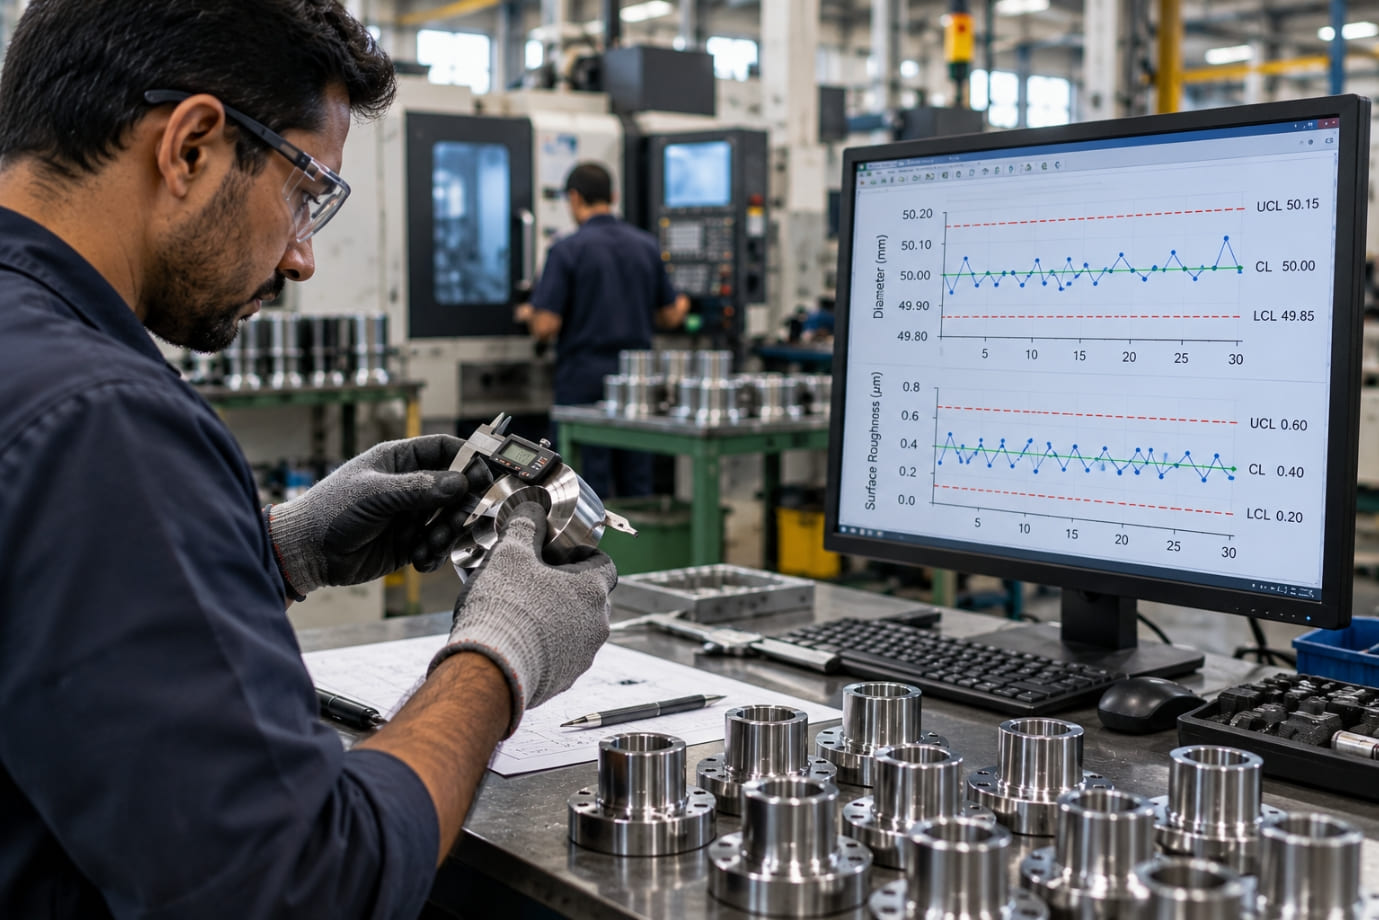
The concept of statistical process control is based on understanding how a process behaves over time. By analysing process variation, manufacturers can distinguish between common cause variation, which occurs naturally within a process and special cause variation, which may indicate a specific problem that needs investigation. Using control charts and other tools, quality teams can make informed decisions based on reliable data rather than guesswork.
In this blog, you will learn about the key methods of statistical process control, different types of it, the difference between control limits and specification limits and the steps involved in following an effective procedure. By the end, you will understand how to implement it in manufacturing, identify process problems earlier, reduce waste and rework and build a more consistent, efficient and quality-focused production system.
What Is Statistical Process Control?
It is a data-driven method used to monitor, measure and improve the performance of a manufacturing process. It uses statistical methods to understand process variation, identify unusual changes and maintain consistent product quality. It’s main goal in manufacturing is to detect potential problems early rather than waiting for defective products to appear. By applying statistical process control techniques, manufacturers can make better decisions, reduce waste and improve production efficiency.
⮞ How SPC Works
The SPC procedure begins with collecting measurements from a production process at regular intervals. These measurements are plotted on control charts, which help teams understand whether the process is behaving consistently. The charts include control limits that indicate the expected range of process variation. When unusual patterns or signals appear, teams investigate possible causes, take corrective action where needed and continue monitoring the results. These tools help distinguish normal common cause variation from unexpected special cause variation.
⮞ SPC vs Traditional Quality Inspection
Traditional quality inspection mainly identifies defects after manufacturing, while SPC focuses on monitoring the process throughout production. Instead of relying only on finished-product checks against specification limits, it helps manufacturers understand why variation occurs and prevent recurring problems. By choosing suitable methods, businesses can move from reactive inspection towards proactive quality management and continuous improvement.
Also read our dedicated blog on the concept of Time Study.
Understanding Process variation in Manufacturing
In any manufacturing process, producing two products with exactly the same measurements is challenging. Small differences can occur due to machines, raw materials, temperature and working conditions. These differences are known as process variation. Understanding this variation is an essential part of Statistical Process Control because it helps manufacturers maintain product quality, reduce defects and improve production efficiency.
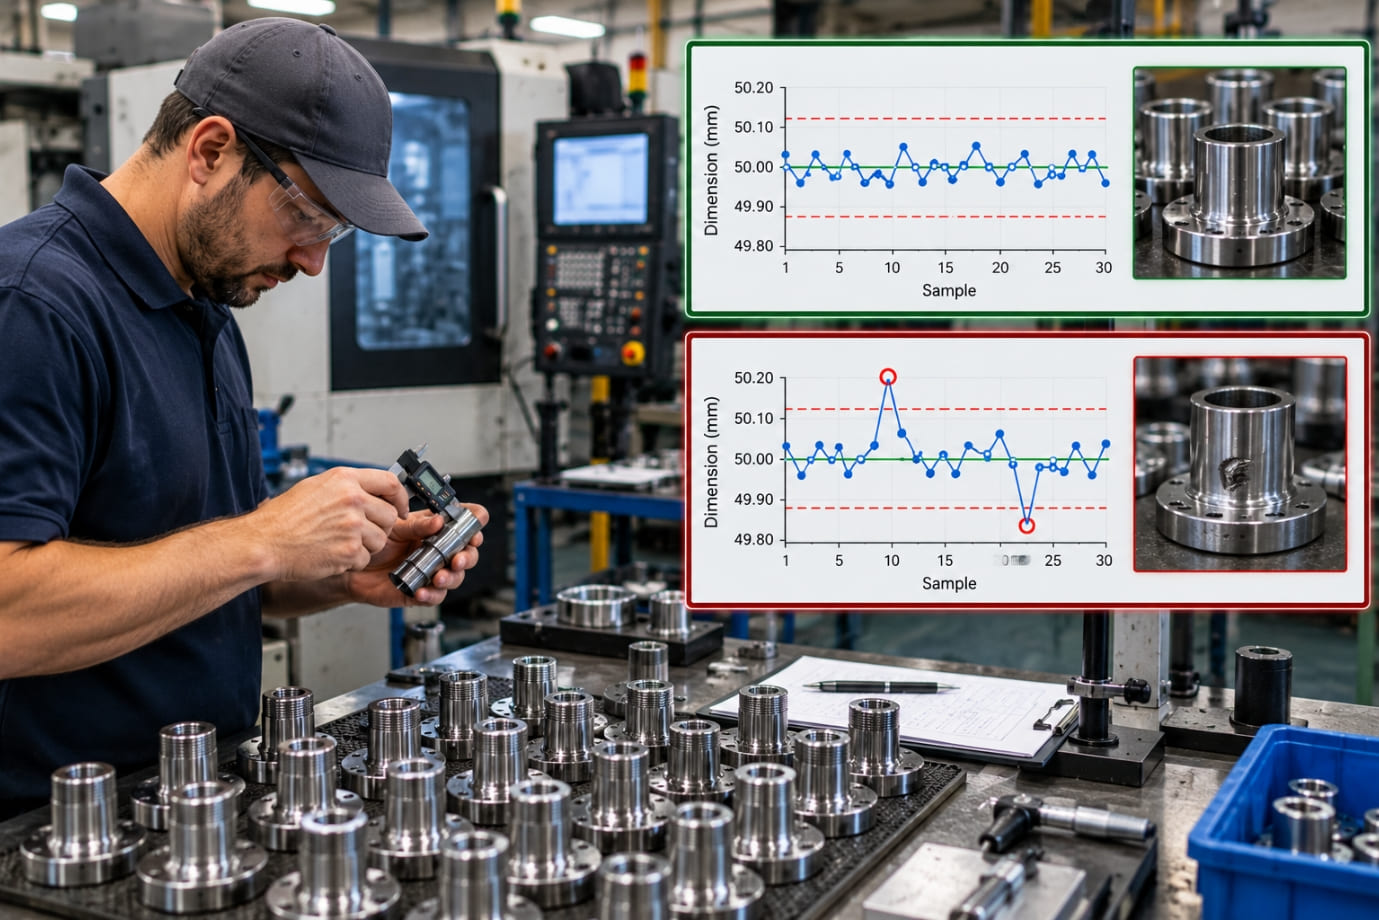
⮞ Common Cause Variation
It refers to the natural differences present in a process operating under consistent conditions. These variations may result from normal machine vibration, minor temperature changes or small differences in raw materials.
For example, a CNC machine producing metal shafts may manufacture components with slightly different diameters, even when its settings remain unchanged. Using control charts helps quality teams determine whether the process is behaving consistently. If the process is stable, improvement usually requires addressing the overall process rather than making frequent adjustments.
⮞ Special Cause Variation
It occurs when an identifiable or unusual factor changes the normal behaviour of a process. Common examples include excessive tool wear, incorrect machine settings, inconsistent raw materials or faulty measuring instruments.
Statistical Process Control charts help manufacturers identify unusual patterns that may indicate a process change. These signals allow teams to investigate potential causes before more defective products are produced. However, a signal indicates a need for investigation, not automatic proof of the cause.
Why Identifying Process variation Matters
Understanding the difference between common and special causes helps manufacturers choose the right corrective action. Unnecessary adjustments to a stable process can increase variation, while ignoring unusual signals can allow quality problems to continue.
An effective procedure involves monitoring data, reviewing control limits, investigating unusual signals and verifying corrective actions. Manufacturers must also understand that control limits differ from specification limits, which define acceptable product requirements.
By using appropriate SPC tools and learning to implement them correctly, businesses can make informed decisions, prevent recurring problems and achieve more consistent production quality. This makes SPC an important approach to continuous improvement and operational excellence in manufacturing.
Also go through: Concept of Motion Study
Key SPC tools and Control charts
SPC uses data and statistical methods to monitor production, identify unusual changes and maintain consistent product quality. In manufacturing, SPC tools help teams understand process variation, investigate problems and reduce defects before they become widespread.
What Is a Control Chart?
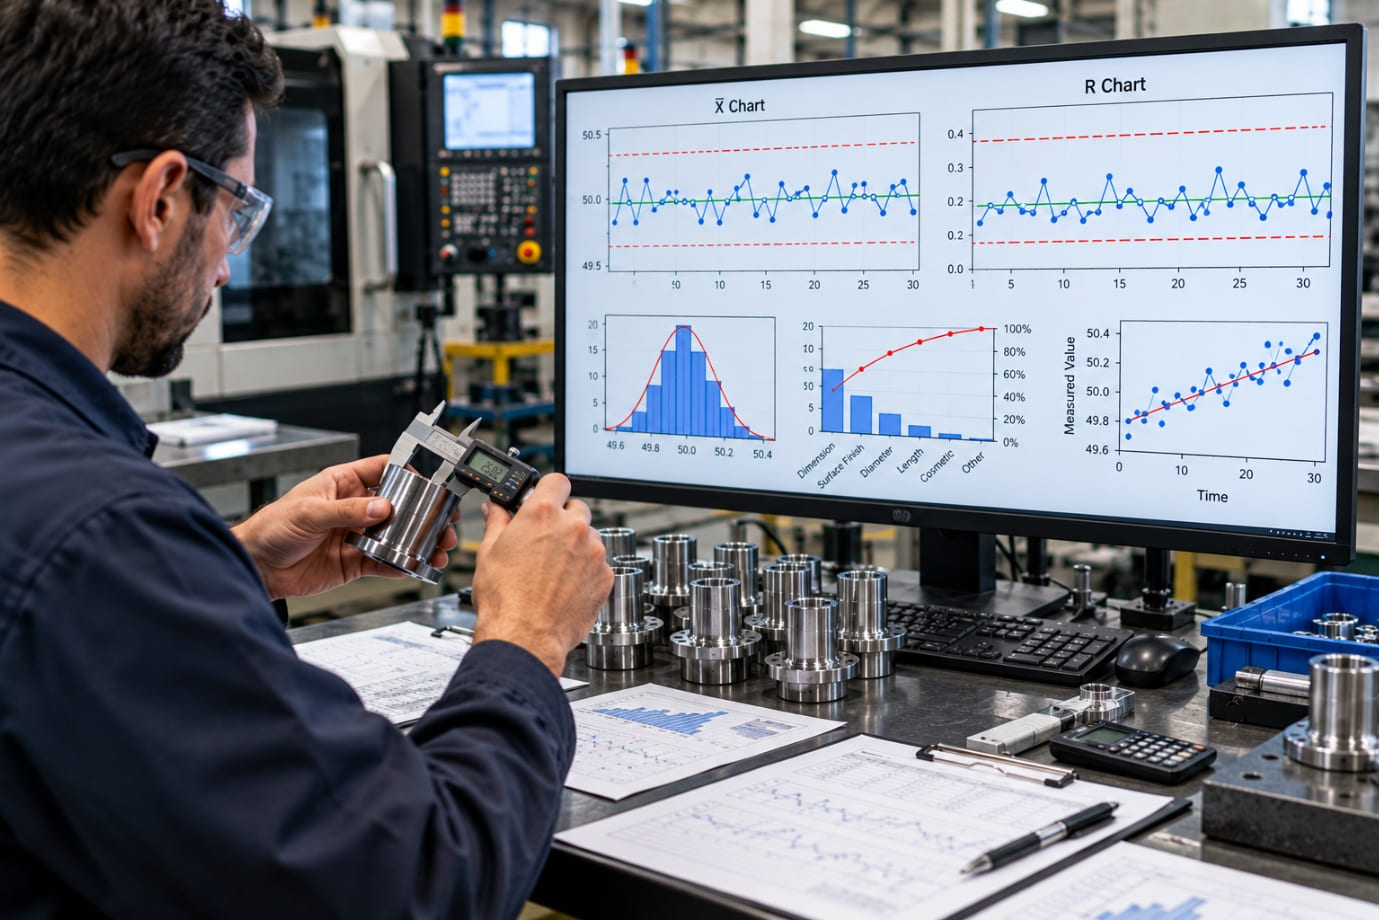
A control chart is a graph that displays process measurements over time. It typically includes a Center Line (CL) representing the process average, an Upper Control Limit (UCL) and a Lower Control Limit (LCL). These limits are calculated using appropriate statistical methods.
Points beyond the limits, unusual trends or non-random patterns may indicate a process change requiring investigation. Even when all points remain within the limits, certain patterns can signal potential problems. Statistical process control charts help distinguish common cause from possible special cause variation, supporting informed decisions.
⮞ Types of SPC Control charts
Different SPC methods use different charts depending on the data:
- X-bar and R charts: Monitor subgroup averages and ranges for measurements such as component diameter.
- I-MR charts: Track individual measurements and moving ranges when observations are collected one at a time.
- p charts: Monitor the proportion of defective units in samples.
- c charts: Track defect counts when inspection opportunities remain constant.
- u charts: Monitor defects per unit when the number of units or opportunities can vary.
Choosing the correct chart is an important part of an effective procedure.
Other Quality Tools Used Alongside SPC
Other SPC techniques complement control charts. Check sheets organize data collection, Pareto charts highlight major problems and histograms display data distribution. Cause-and-effect diagrams help investigate possible root causes, while scatter diagrams reveal relationships between variables.
Together, these tools help manufacturers investigate problems systematically and improve process performance. When businesses implement SPC effectively, they can reduce waste and strengthen quality management.
SPC Control Limits vs Specification Limits
Understanding the difference between control limits and specification limits is essential for effective SPC. Both support quality management, but they serve different purposes in manufacturing.
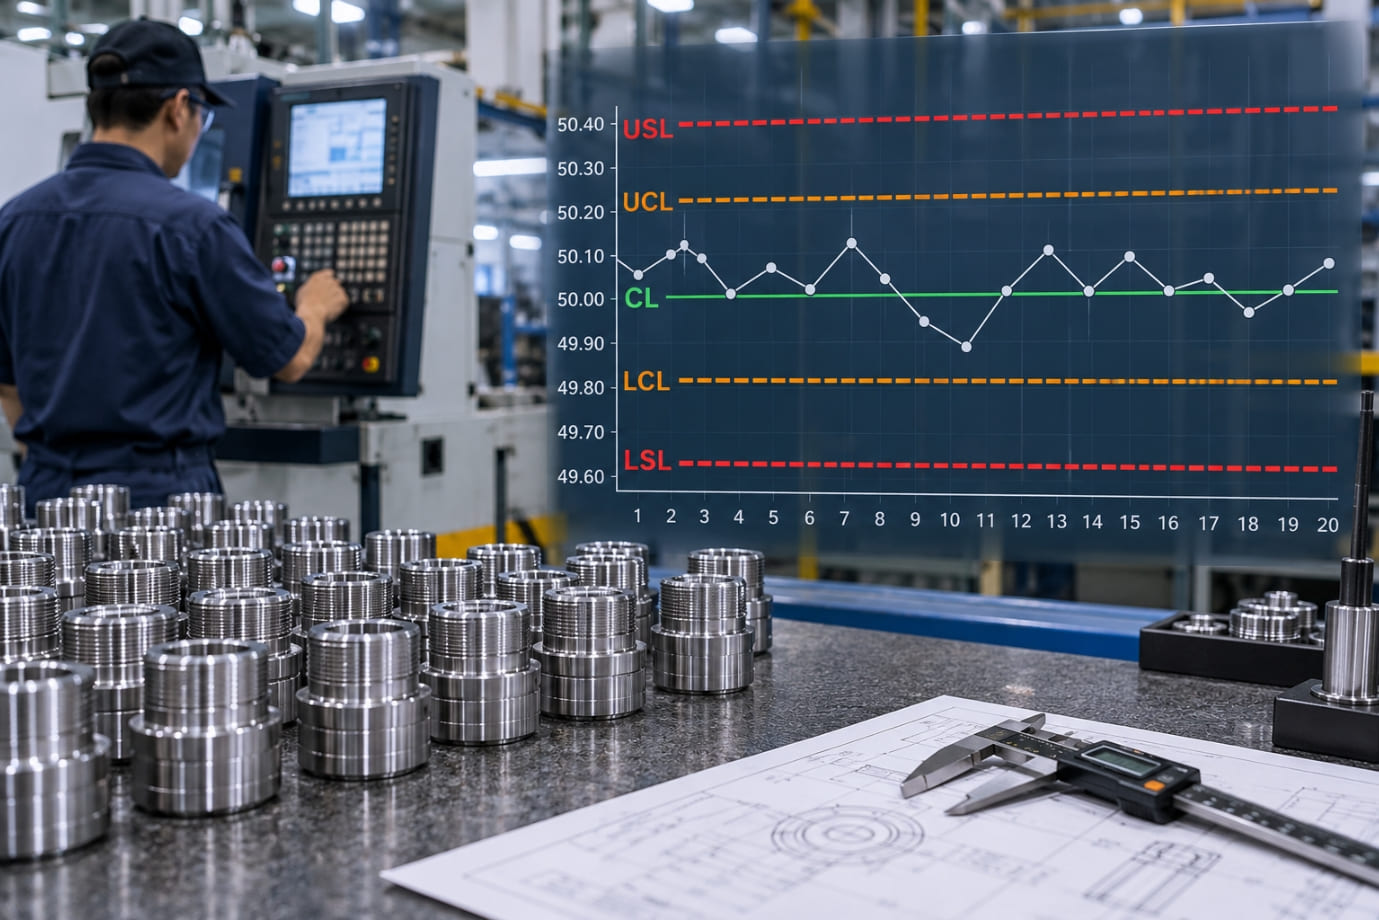
- Control Limits: These are calculated from process data and displayed on control charts. They help determine whether a process is stable or showing unusual variation. When a chart reveals unexpected patterns, teams should investigate possible special cause variation before making adjustments.
- Specification Limits: In contrast, these are defined by customers, engineering drawings, or applicable requirements. They establish the acceptable range for a product characteristic. For example, if a component must measure 20.00 ± 0.05 mm, its specification limits are 19.95 mm and 20.05 mm.
A process can be statistically stable but still produce components outside specification. Similarly, products may meet specifications while the process remains unstable. Therefore, statistical process control in manufacturing requires monitoring both process behaviour and product requirements.
Also Read: Predetermined Motion Time System (PMTS)
How Cp and Cpk Relate to SPC
The process capability index (Cp) compares the natural spread of a stable process with the specification range. Cpk also considers whether the process is centred between the specification limits. Together, Cp and Cpk help manufacturers evaluate their ability to meet quality requirements consistently.
As part of an effective procedure, capability should be assessed using reliable data from a stable process. Combining SPC and Cpk helps manufacturers understand process performance, reduce defects and improve product consistency.
Benefits of Statistical Process Control in Manufacturing
Statistical Process Control helps manufacturers maintain consistent product quality while improving productivity and controlling operating costs. By monitoring production data and identifying unusual changes early, statistical process control enables businesses to prevent recurring problems instead of simply reacting to defects.

⮞ Reduce Defects, Scrap and Rework
One of the main benefits of SPC is its ability to identify process changes before they lead to widespread quality issues. Using control charts and other SPC tools, teams can investigate unusual signals, reduce defective products and minimize material waste and rework.
⮞ Improve Process Consistency and Productivity
Monitoring process variation helps manufacturers understand why production results differ. Addressing special cause variation and improving the underlying process can reduce interruptions, support smoother workflows and improve production consistency.
⮞ Make Decisions Using Data
Statistical Process Control charts provide clear information about process behaviour. They help teams distinguish normal common cause variation from unusual changes that require investigation. This reduces guesswork and supports better decisions.
⮞ Reduce the Cost of Poor Quality
Fewer defects, rejected products and repeated repairs can lower manufacturing costs. When businesses implement SPC effectively, they can use resources more efficiently and reduce avoidable losses without compromising product standards.
⮞ Support Continuous Improvement and Customer Satisfaction
An effective statistical process control procedure helps teams monitor results and sustain improvements over time. Combined with Cp and Cpk, which assess process capability when appropriate, it helps manufacturers evaluate whether their processes can consistently meet specification limits.
Overall, statistical process control techniques support reliable production, stronger quality management and greater customer confidence. By integrating SPC into daily operations, manufacturers can build a foundation for continuous improvement and long-term operational excellence.
How to Implement SPC in a Manufacturing Process
To achieve consistent product quality, manufacturers need more than occasional inspections. They need a systematic way to monitor production, understand process variation and respond to changes before they cause costly defects. Implementing SPC involves collecting reliable data, selecting suitable control charts and using the results to improve manufacturing performance. The following steps explain how to introduce it in manufacturing effectively.
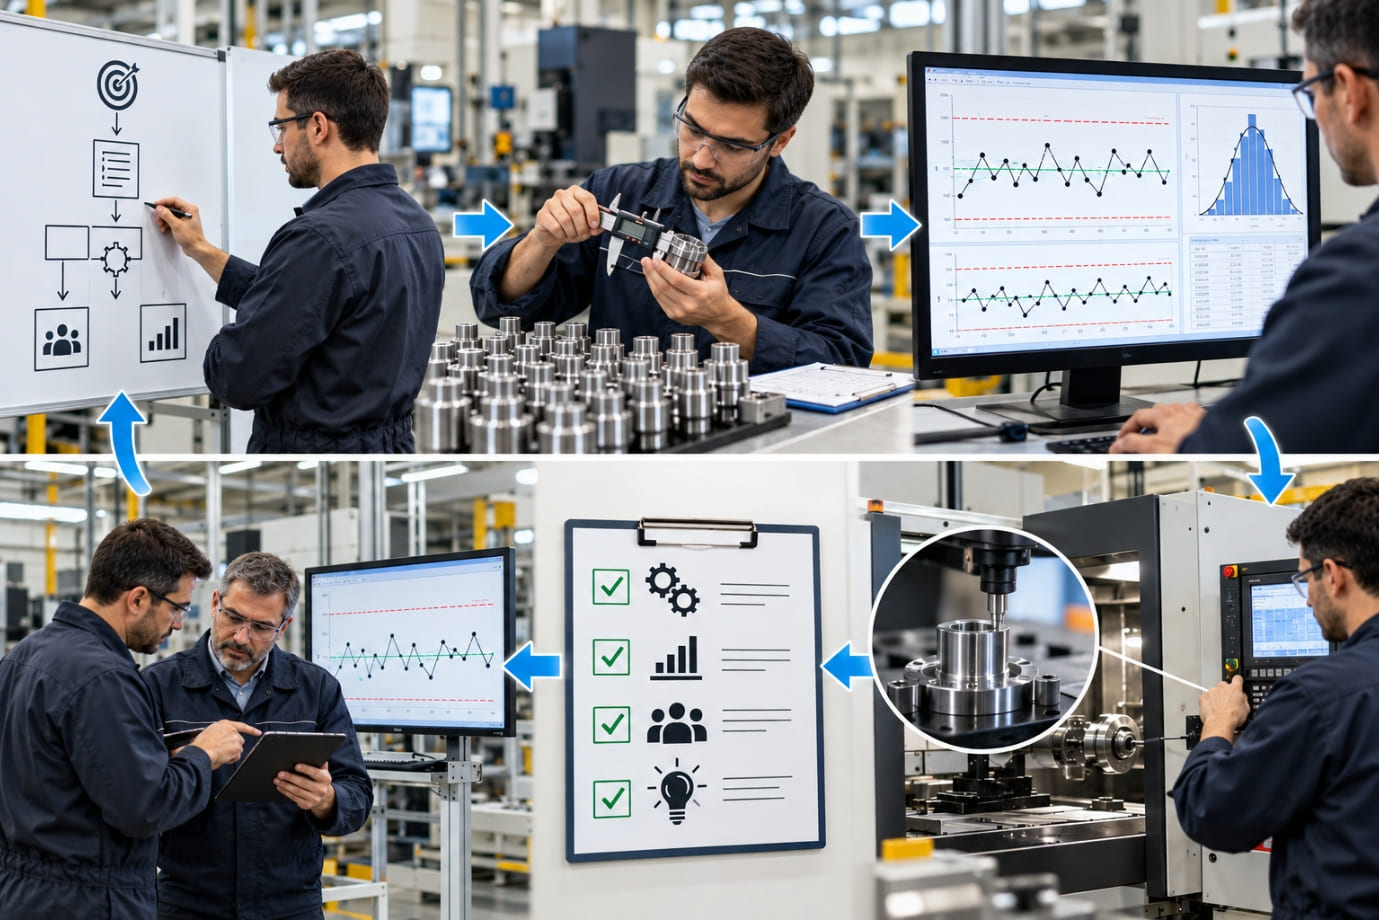
Step 1: Select a Critical Process or Quality Characteristic
Start by identifying a process that directly affects product quality, safety, reliability or production costs. For example, a manufacturer may monitor the diameter of a machined component or the temperature of an injection moulding process. Choosing a measurable characteristic with a clear business impact helps to focus the process of SPC on meaningful improvements.
Step 2: Validate the Measurement System
Before collecting data, ensure that measuring instruments are calibrated and operators follow consistent measurement methods. A reliable measurement system is essential because inaccurate readings can lead to incorrect conclusions about process performance.
Step 3: Collect Representative Process Data
Establish a suitable sampling plan that specifies what to measure, how often to measure it and how much data to collect. Select appropriate statistical process control methods based on the type of data and production conditions. For example, variable data may require an X-bar and R chart or an I-MR chart.
Step 4: Establish and Interpret Control limits
Establish a suitable sampling plan that specifies what to measure, how often to measure it and how much data to collect. Select appropriate statistical process control methods based on the type of data and production conditions. For example, variable data may require an X-bar and R chart or an I-MR chart.
Step 5: Investigate Signals and Take Corrective Action
When unusual signals appear, investigate potential causes such as tool wear, incorrect settings or material inconsistencies. Distinguish special cause variation from common cause variation before taking action. Avoid unnecessary adjustments to an otherwise stable process.
Step 6: Sustain Improvements
Assign responsibility for monitoring results, train employees, document corrective actions and review performance regularly. Once stability is established, Cp and Cpk can help evaluate process capability.
By following these steps and using appropriate tools, manufacturers can implement SPC as an ongoing improvement practice, helping reduce waste, maintain consistent quality and strengthen operational excellence.
Common SPC Implementation Challenges
Although SPC helps improve manufacturing quality, implementing it successfully requires proper planning, reliable data and consistent follow-through. Businesses may face several challenges when introducing SPC in manufacturing, including:
- Inaccurate measurement data: Poorly calibrated instruments or inconsistent measurement methods can lead to misleading results. Reliable data is essential for understanding process variation and setting appropriate control limits.
- Incorrect chart selection or interpretation: Choosing unsuitable control charts can lead to incorrect decisions. Teams must understand the appropriate methods for their data.
- Insufficient training and unclear ownership: Employees need practical training to use SPC tools, recognize special cause variation and distinguish it from common cause variation. Clear responsibilities help ensure problems are investigated promptly.
- Collecting data without taking action: It provides value only when teams investigate signals, identify root causes and implement corrective measures. Collecting measurements without follow-through rarely improves performance.
To implement SPC effectively, manufacturers need sound measurement practices, appropriate statistical methods, management support and disciplined execution. Once process stability is established, Cp and Cpk can help evaluate capability against specification limits. Integrating SPC into daily operations makes quality improvement a continuous practice rather than a one-time activity.
The Role of SPC in Operational Excellence
SPC supports operational excellence by helping manufacturers improve product quality, reduce waste and maintain consistent production. Its key contributions include:
- Proactive quality management: SPC helps teams monitor production continuously and identify potential problems before they lead to widespread defects.
- Waste reduction through Lean Manufacturing: SPC helps identify process variation that contributes to scrap, rework and production inefficiencies.
- Data-driven improvement with Six Sigma and DMAIC: Control charts and other SPC tools support root-cause analysis, corrective action and ongoing process monitoring. For more information, read our dedicated blog on Six Sigma concept.
- Better variation management: It helps distinguish common cause from special cause variation, enabling teams to take appropriate action.
- Improved process capability: Combining SPC and Cpk, along with the Cp, helps manufacturers assess whether a stable process can meet specification limits consistently.
- Continuous improvement: By integrating statistical process control into daily operations, manufacturers can move from reactive defect detection to proactive process management and sustain long-term operational efficiency. Also go through our comprehensive blog on Kaizen concept.
FAQs
A. Statistical process control (SPC) is a data-driven method used to monitor production processes, understand process variation and identify unusual changes. It helps manufacturers maintain consistent quality and take corrective action before small problems lead to widespread defects.
A. The seven basic tools commonly include check sheets, histograms, Pareto charts cause-and-effect diagrams, scatter diagrams, control charts and stratification. Some versions replace stratification with flowcharts or other process-mapping tools. For detailed information, read our in-depth blog on 7 QC Tools.
A. The main types of control charts include X-bar and R charts and I-MR charts for measurable data and p, c and u charts for attribute data. The appropriate chart depends on the data type, sampling method and process being monitored.
A. SPC monitors process behaviour using statistical methods, while Six Sigma is a broader improvement methodology focused on reducing defects and variation. It can support Six Sigma projects by tracking process performance and sustaining improvements.
A. Statistical process control in manufacturing uses control charts to identify unusual process changes. Investigating these signals helps teams find root causes, take corrective action, reduce rework and prevent recurring quality problems.
A. Yes, SPC in manufacturing can begin with one critical process, reliable measurement equipment, a suitable control chart and trained employees. Businesses can expand their programme gradually as their quality management capabilities develop.
A. Common cause variation is the natural variation within a consistent process, while special cause variation results from an identifiable change, such as tool wear, incorrect machine settings or inconsistent raw materials. Identifying the difference helps teams choose appropriate corrective actions.
A. Statistical process control charts display process measurements over time using a center line and upper and lower control limits. They help identify unusual points, trends or patterns that may indicate a change requiring investigation.
Conclusion
Maintaining consistent product quality requires more than inspecting finished products. Statistical process control helps manufacturers understand how their processes behave, monitor process variation and identify unusual changes before they develop into larger quality problems. By using control charts and other SPC tools, businesses can make informed decisions based on reliable production data rather than guesswork.
An effective procedure helps team distinguish common cause from special cause variation, investigate root causes and take appropriate corrective action. When manufacturers implement it correctly, they can reduce defects, minimize scrap and rework, improve productivity and strengthen customer confidence.
Combining SPC and Cpk provides further insight into process performance. While SPC helps monitor process stability, Cpk and Cp help assess whether a stable process can consistently meet specification limits.
Ultimately, SPC supports continuous improvement, cost efficiency and long-term operational excellence.
By adopting the right methods, manufacturers can move from reactive defect detection to proactive quality management. Start by identifying a critical production process, collecting reliable data and applying suitable control charts. With consistent monitoring, employee involvement and timely corrective action, your business can build more reliable processes, reduce avoidable losses and achieve sustainable manufacturing performance.
For more information regarding our services, you can explore our Homepage.